object(WP_Post)#12739 (24) { ["ID"]=> int(7914) ["post_author"]=> string(1) "1" ["post_date"]=> string(19) "2025-06-10 09:44:04" ["post_date_gmt"]=> string(19) "2025-06-10 09:44:04" ["post_content"]=> string(768) "

Sorry, this entry is only available in Español. For the sake of viewer convenience, the content is shown below in the alternative language. You may click the link to switch the active language.

" ["post_title"]=> string(7) "Grafana" ["post_excerpt"]=> string(0) "" ["post_status"]=> string(7) "publish" ["comment_status"]=> string(6) "closed" ["ping_status"]=> string(6) "closed" ["post_password"]=> string(0) "" ["post_name"]=> string(31) "grafana-software-observabilidad" ["to_ping"]=> string(0) "" ["pinged"]=> string(0) "" ["post_modified"]=> string(19) "2025-06-11 13:35:41" ["post_modified_gmt"]=> string(19) "2025-06-11 13:35:41" ["post_content_filtered"]=> string(0) "" ["post_parent"]=> int(0) ["guid"]=> string(31) "https://tobeit.es/?page_id=7914" ["menu_order"]=> int(0) ["post_type"]=> string(4) "page" ["post_mime_type"]=> string(0) "" ["comment_count"]=> string(1) "0" ["filter"]=> string(3) "raw"}
Panel Cookies

Observability with Grafana

Visualize and master your data


At ToBeIT, we are official Grafana partners in Spain.
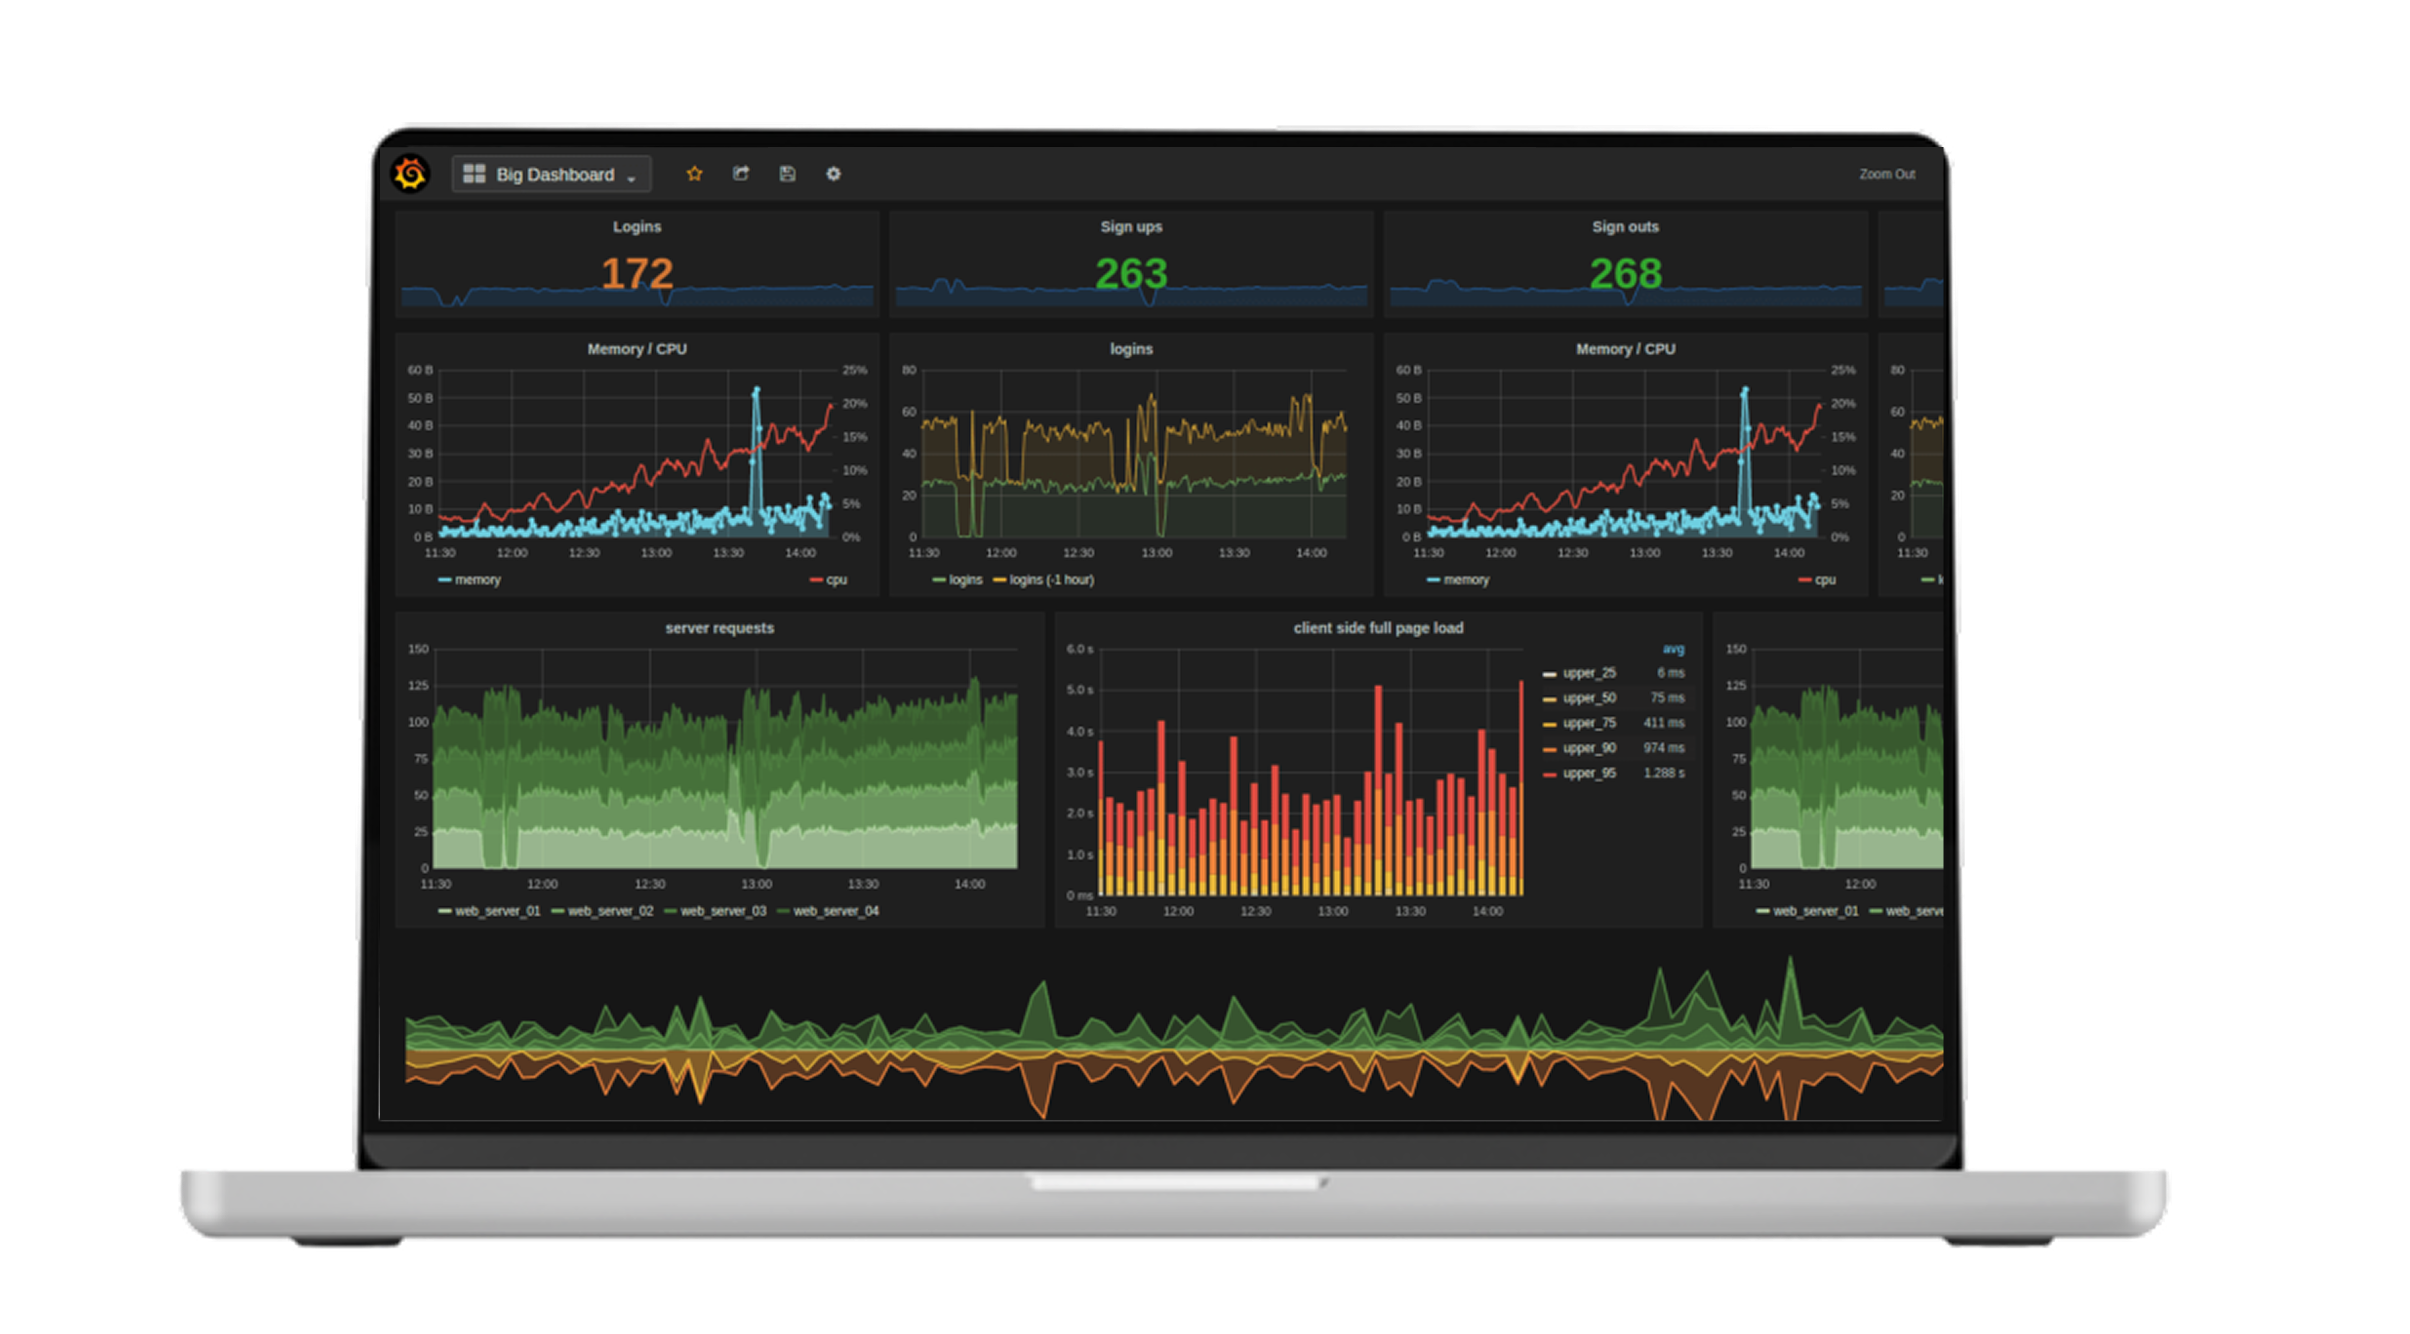
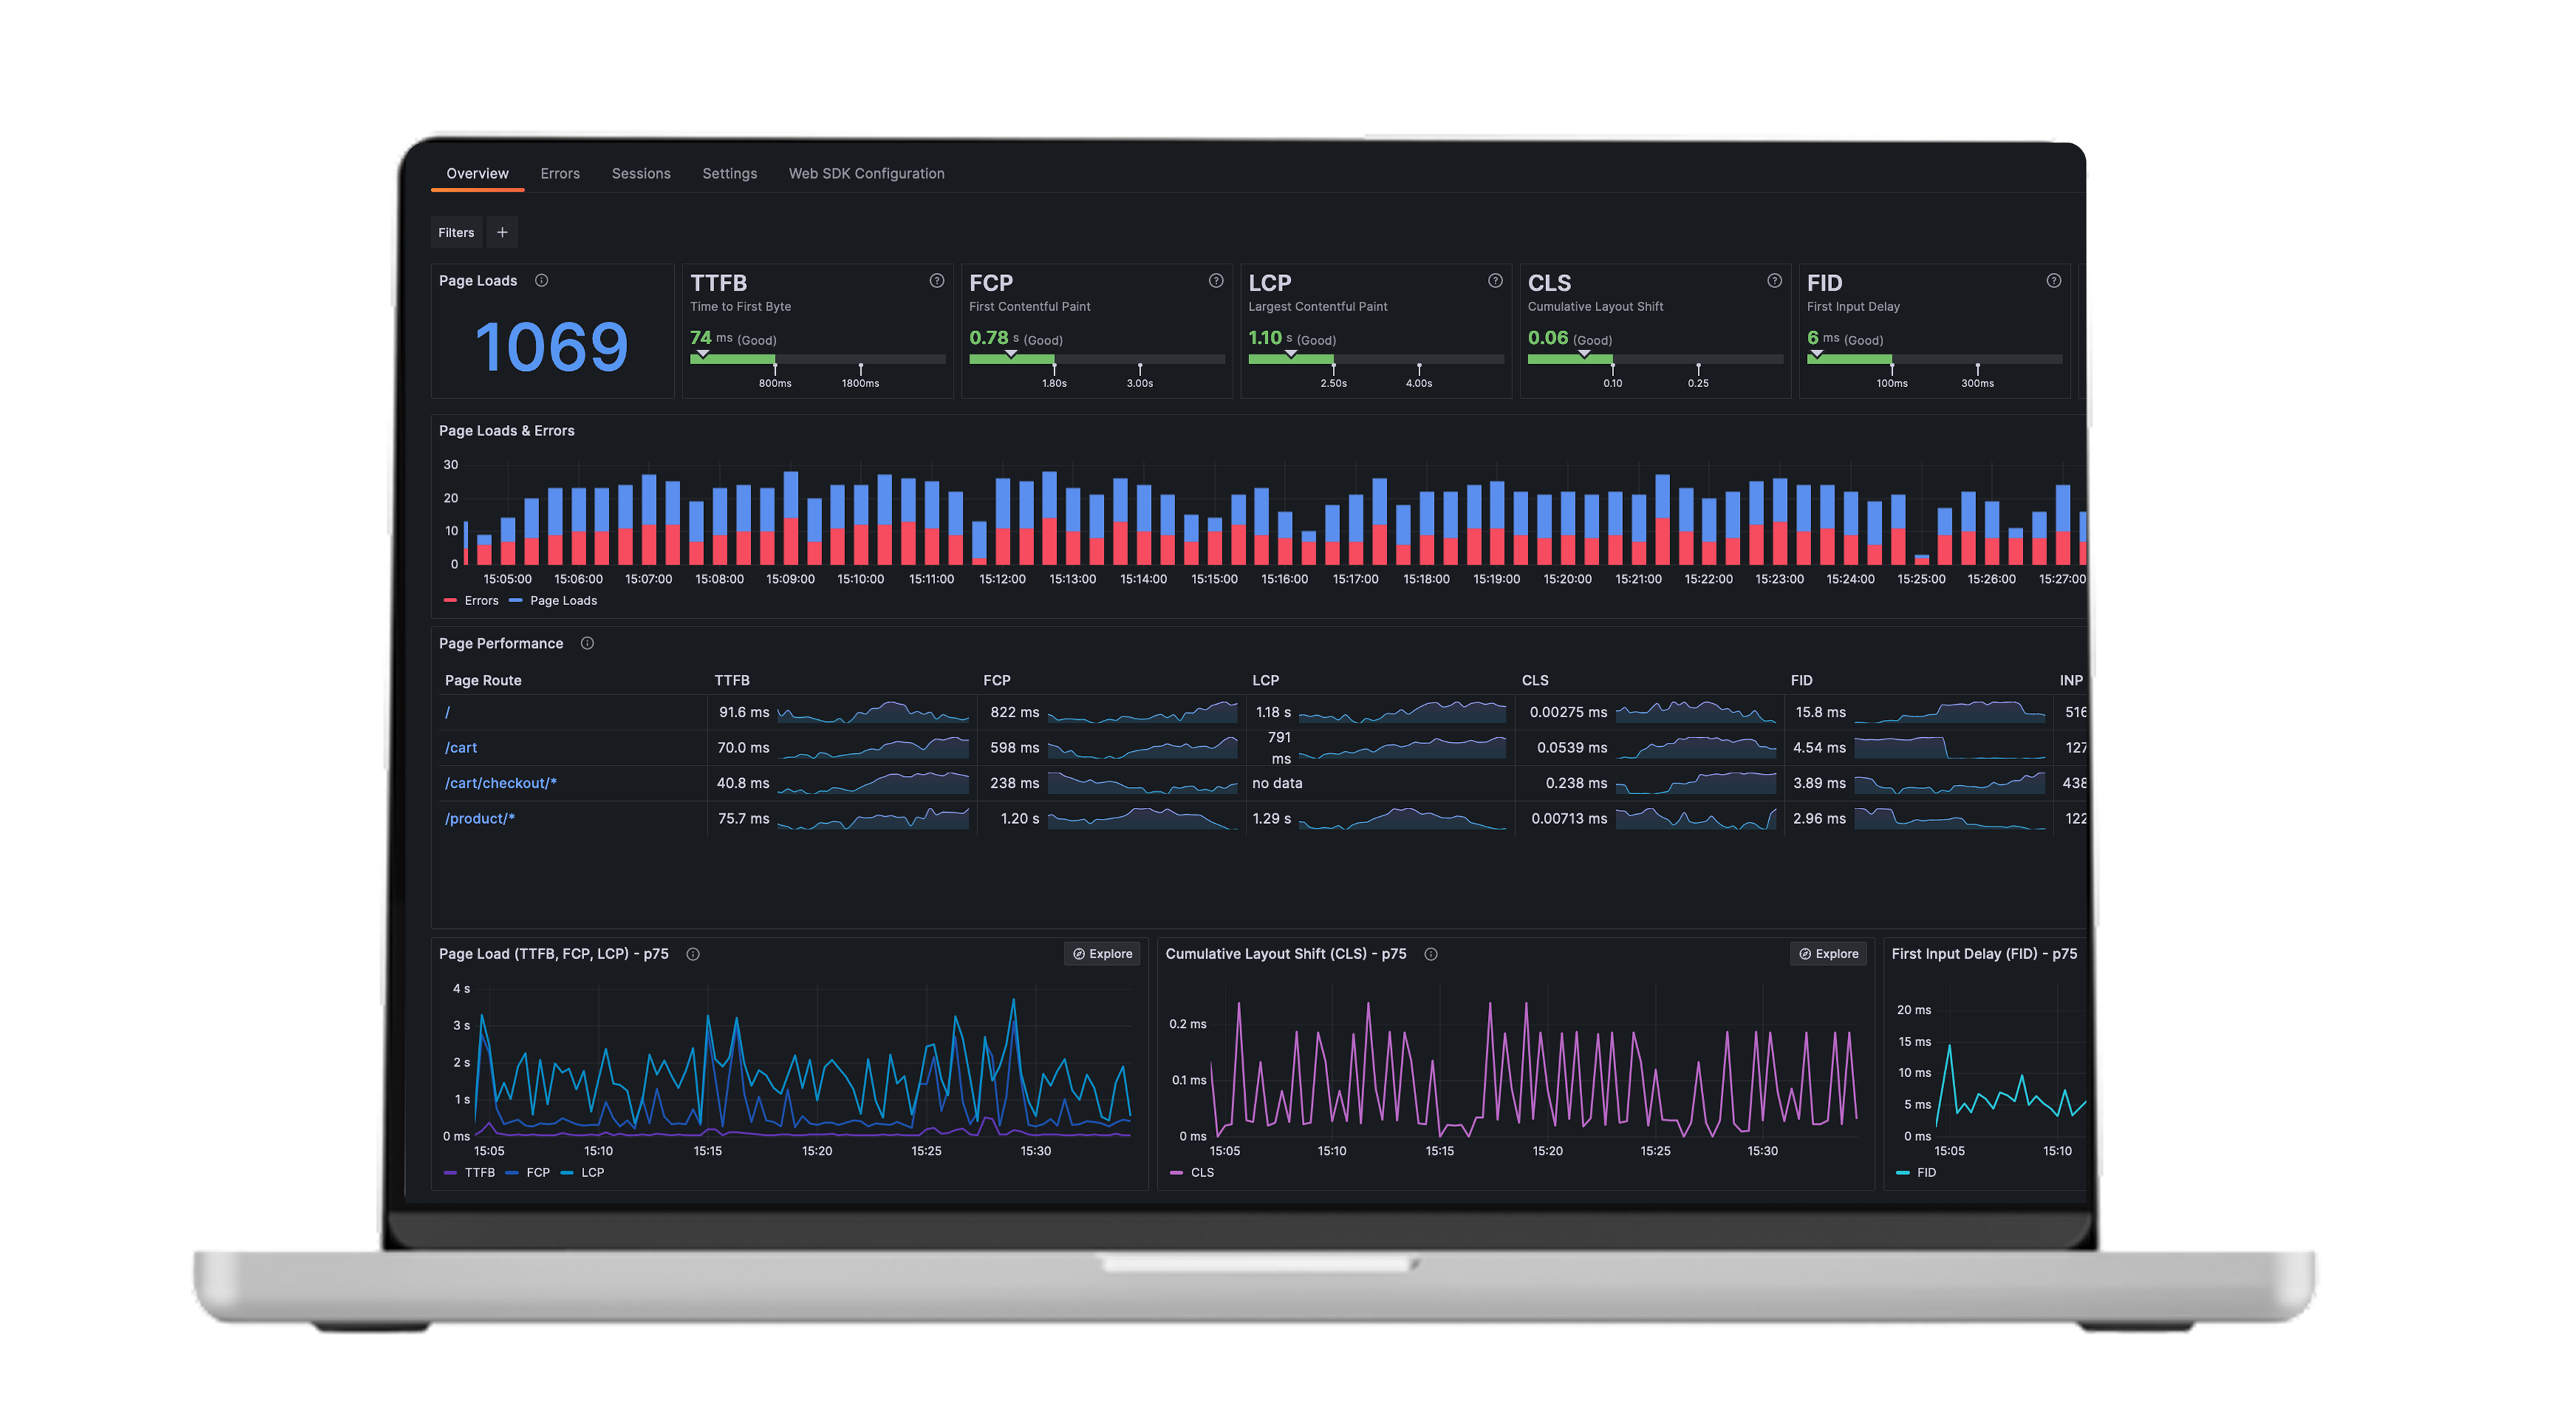
As IT Monitoring and Observability specialists, we help you turn your data into clear, actionable insights using
Grafana and its customized, integrated, and optimized dashboards.

Want to visualize your metrics in real time? Request a free demo with no obligation.

Request information

    Accept the conditions of the legal advice

    Why you should choose Grafana software with ToBeIT?

    • Customizable dashboards with visualizations tailored to each team
    • Easy integration with multiple data sources: Prometheus, Loki, SQL, Cloud…
    • Advanced real-time configurable alerts
    • Scalability and performance for complex or high-volume environments
    • Expert training and technical support, from deployment to daily use

    What is Grafana?

    Grafana is the leading open-source observability platform for interactive data visualization.
    With Grafana software, you unify all your metrics, logs, and traces into centralized, real-time visual panels.

    Designed to provide an intuitive, flexible, and data-source-agnostic experience, Grafana allows you to:

    • Unify metrics in a single interface
    • Detect anomalies in seconds
    • Explore trends with interactive Grafana dashboards

    What do we offer as a Grafana Partner?

    At ToBeIT, we offer Grafana as a service, tailored to meet all your technical needs:

    • Grafana implementation and setup
      We deploy and adapt Grafana software in your environment (on-premise or cloud), integrating it with your existing data sources.
    • Grafana dashboard development
      We design custom dashboards using panels like Graph, Table, Stat, or Heatmap according to each department’s needs.
    • Data source integration
      We connect Grafana with Prometheus, InfluxDB, SQL Server, Elasticsearch, AWS CloudWatch, Azure Monitor, and more.
    • Alerting and notification system
      We configure rules and channels (Slack, email, PagerDuty, webhooks) for proactive monitoring.
    • Optimization and technical support
      We advise on performance, scalability, data persistence, and provide specialized L3 support.

    Start transforming your data with ToBeIT and Grafana

    Whether you’re implementing Grafana from scratch or improving your existing dashboards, ToBeIT is ready to help.
    Visualize the present, anticipate the future, and make smarter decisions with expert-designed Grafana dashboards.

    Request a free consultation or a Grafana software demo today.

    They have trusted us

    Contact

    Contact our specialists to assess your project.
    Request information or, if you prefer, call us at 937 377 773 / 910 604 006.

      Accept the conditions of the legal advice