object(WP_Post)#8328 (26) { ["ID"]=> int(5798) ["post_author"]=> string(1) "1" ["post_date"]=> string(19) "2024-02-21 12:19:30" ["post_date_gmt"]=> string(19) "2024-02-21 12:19:30" ["post_content"]=> string(0) "" ["post_title"]=> string(19) "Root Cause Analysis" ["post_excerpt"]=> string(0) "" ["post_status"]=> string(7) "publish" ["comment_status"]=> string(6) "closed" ["ping_status"]=> string(6) "closed" ["post_password"]=> string(0) "" ["post_name"]=> string(19) "analisis-causa-raiz" ["to_ping"]=> string(0) "" ["pinged"]=> string(0) "" ["post_modified"]=> string(19) "2024-02-21 12:24:58" ["post_modified_gmt"]=> string(19) "2024-02-21 12:24:58" ["post_content_filtered"]=> string(0) "" ["post_parent"]=> int(0) ["guid"]=> string(31) "https://tobeit.es/?page_id=5798" ["menu_order"]=> int(0) ["post_type"]=> string(4) "page" ["post_mime_type"]=> string(0) "" ["comment_count"]=> string(1) "0" ["filter"]=> string(3) "raw" ["post_title_ml"]=> string(84) "[:es]Análisis de Causa Raíz[:en]Root Cause Analysis[:ca]Anàlisi de Causa Arrel[:]" ["post_title_langs"]=> array(3) { ["es"]=> bool(true) ["en"]=> bool(true) ["ca"]=> bool(true) }}
Panel Cookies

Root Cause Analysis

¿How can we help you?

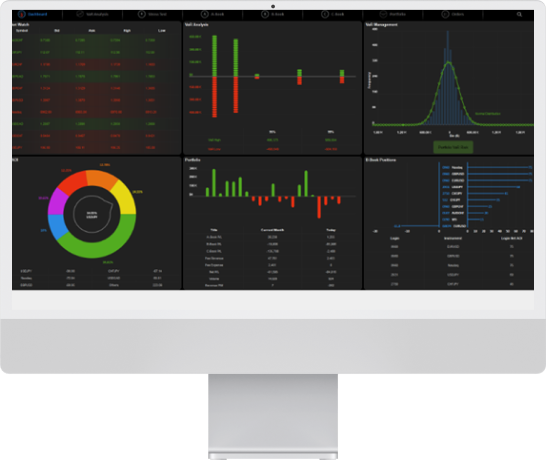
When applications encounter problems that defy conventional analysis without revealing their origin, ToBeIT implements a comprehensive solution to transcend these obstacles. We deploy an advanced observability platform around the application, complemented by conducting a stress test. This dual approach not only illuminates existing issues but also provides the critical information needed to accurately identify the root cause.

Contact

Our observability platform is designed to capture a full spectrum of data on the performance and health of the application, using various sources and specialized tools:

  • Metrics: We perform an exhaustive collection of metrics from all the technological components involved in the application, allowing us to obtain a global view of performance and detect anomalies.
  • Logs: We analyze in detail any type of log generated by the application to identify errors, warnings, and unusual patterns that may indicate underlying problems.
  • APM (Application Performance Management): We ingest APM traces to monitor the behavior of the application server, including response times, failed requests, and other key performance indicators.
  • RUM (Real User Monitoring): We collect telemetry directly from the users’ browsers to understand the end-user experience, including page load times, user interactions, and potential errors on the client side.

Contact

Contact our specialists to assess your project.
Request information or, if you prefer, call us at 937 377 773 / 910 604 006.

Accept the conditions of the legal advice